Exploration
PCA from first principles: what drives variation in matched HGSOC RNA-seq?
Implementing PCA from scratch shows both how it works and when it stops saying what we think it says.
Last updated 25 September 2026
What is the PCA separating?
GSE133296 contains ten matched triplets collected during primary debulking surgery: a primary ovarian tumour, an omental metastasis and a non-omental intraperitoneal metastasis from each patient. The question is whether expression profiles follow the person from whom they came or the tissue context in which the tumour was sampled.
Shared genetics, evolutionary history and patient-specific tumour biology.
One ovarian, one omental and one non-omental tumour deposit per patient.
Macrodissected tumour areas from archival sections, with the limitations that implies.
Each site appears once per patient. Comparing ten ovarian samples with ten omental samples also carries the differences between patients inside both groups; the matched structure cannot be ignored.
From expression matrix to sample geometry
- 01Matrix
- 02Centring
- 03SVD
- 04Scores
- 05Loadings
Brief video transcript
The animation moves from the expression matrix to centred gene values, shows the singular-value decomposition, then identifies sample scores and gene loadings. The two-gene view illustrates the transformation; the reported PCA uses the complete selected 500-gene matrix.
Every preprocessing choice changes the space PCA sees
The decomposition does not receive “the RNA-seq data” in the abstract. It receives the matrix left behind by filtering, normalisation, transformation and feature selection.
Start with what was measured
Raw counts
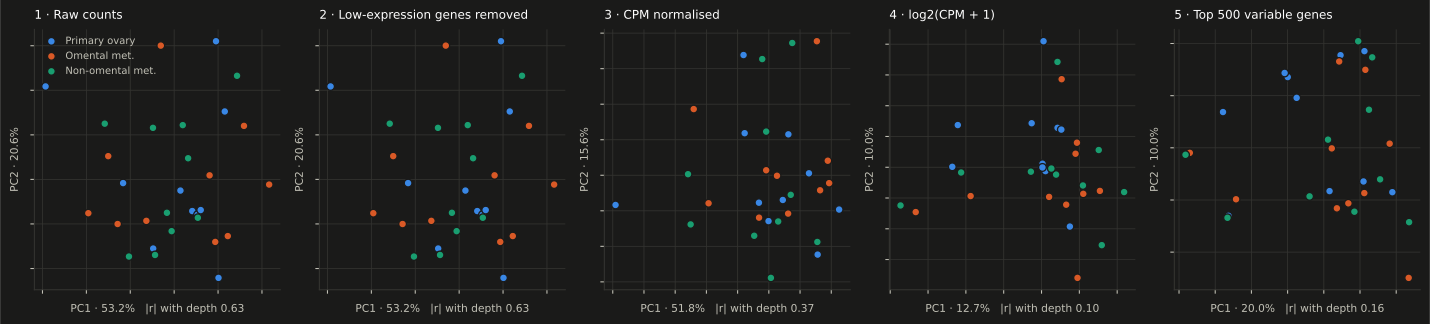
PC1 explains 53.2% of variance. Its absolute association with sequencing depth is 0.628.
Remove low-expression genes
Expression filter
The filter removes 66% of genes while retaining 99.5% of mapped reads.
Account for library size
CPM normalisation
Normalising by library size weakens the depth-driven structure.
Compress the dynamic range
log₂(CPM + 1)
The logarithm changes which expression differences dominate the distances between samples.
Focus the final matrix
Top 500 variable genes
PC1 explains 20.0% of variance and its absolute association with depth falls to 0.164.
PC1 explains 53.2% of variance. Its absolute association with sequencing depth is 0.628.
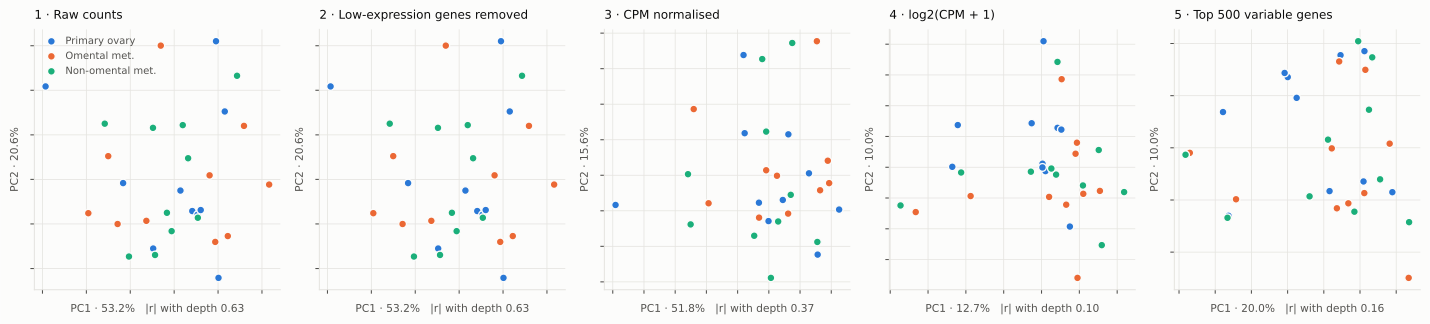
Scroll sideways on small screens · Open full-size SVG:light / dark
Changing the scale changes almost the entire input set
- CPM ranking
- 372.9median CPM
- log₂-CPM ranking
- 15.9median CPM
The scale used before ranking variance changes almost the whole set of genes entering the analysis.
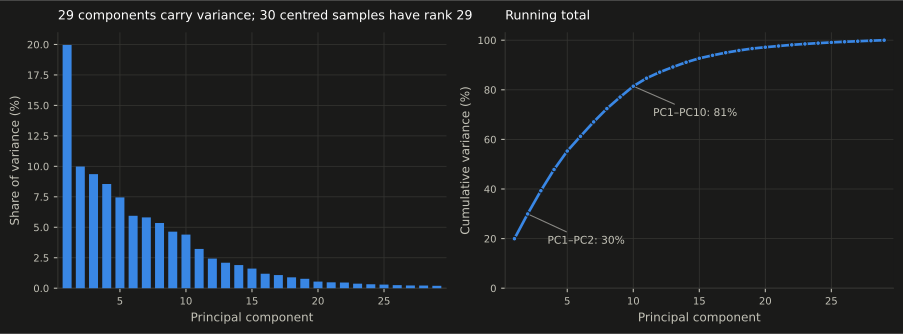
The variance declines without an obvious elbow
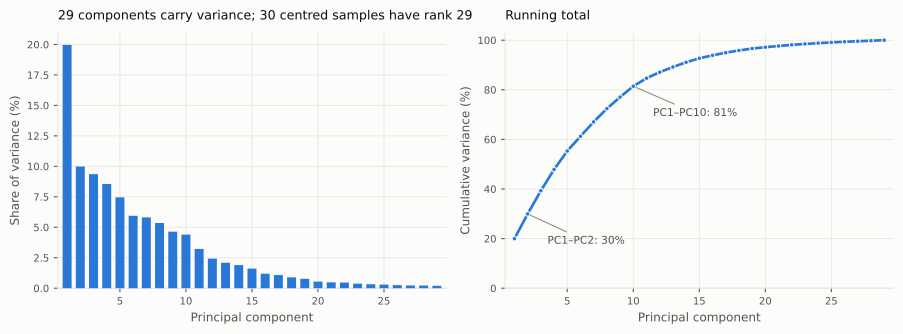
Scroll sideways on small screens · Open full-size SVG:light / dark
The same points reveal different structure
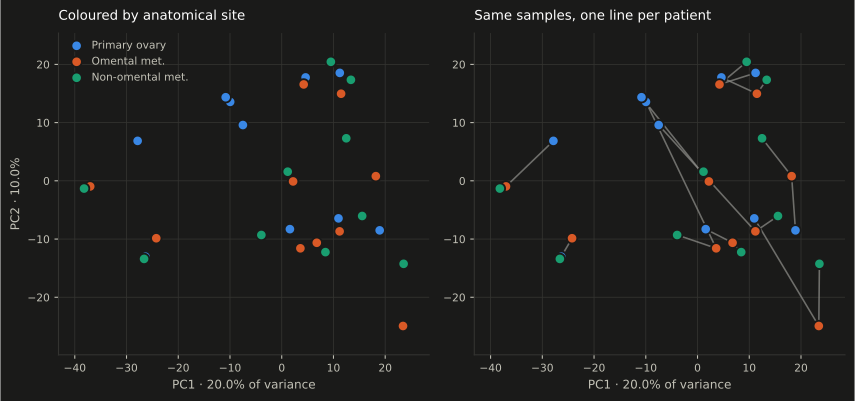
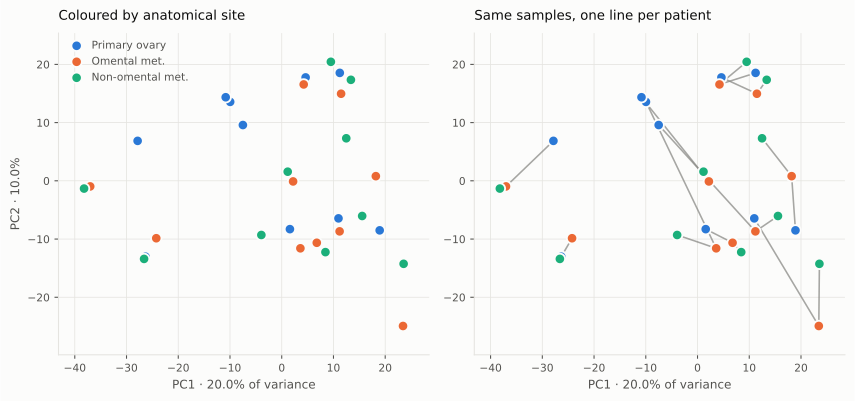
Colouring the projection by site produces substantial overlap. Connecting the three samples from each patient exposes a stronger patient-specific organisation.
Scroll sideways on small screens · Open full-size SVG:light / dark
| Factor | Within | Between | Ratio |
|---|---|---|---|
| Patient | 35.70 | 56.60 | 1.585 |
| Site | 54.97 | 55.25 | 1.005 |
Within the global geometry represented by these distances, patient identity is the dominant organising factor.
Immunoglobulin genes dominate the extreme loadings
Scroll sideways on small screens · Open full-size SVG:light / dark
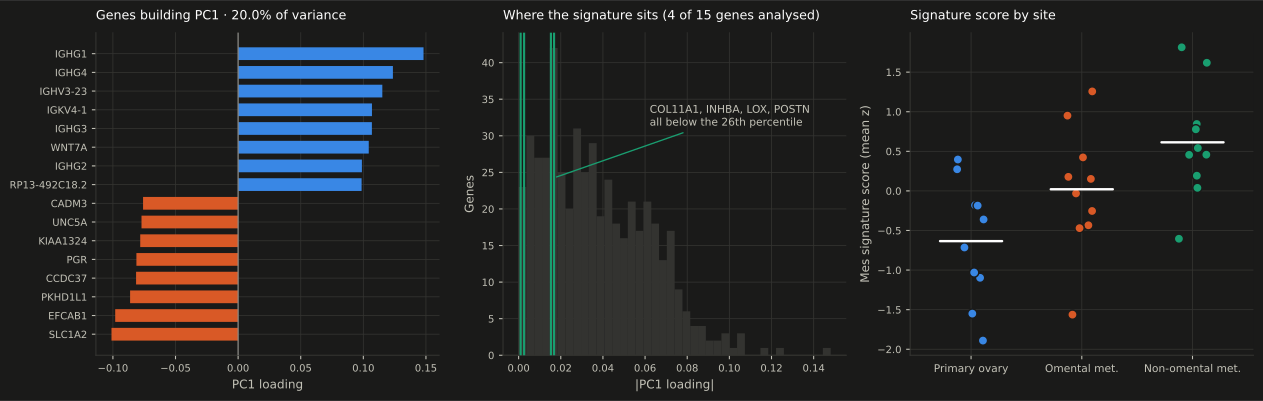
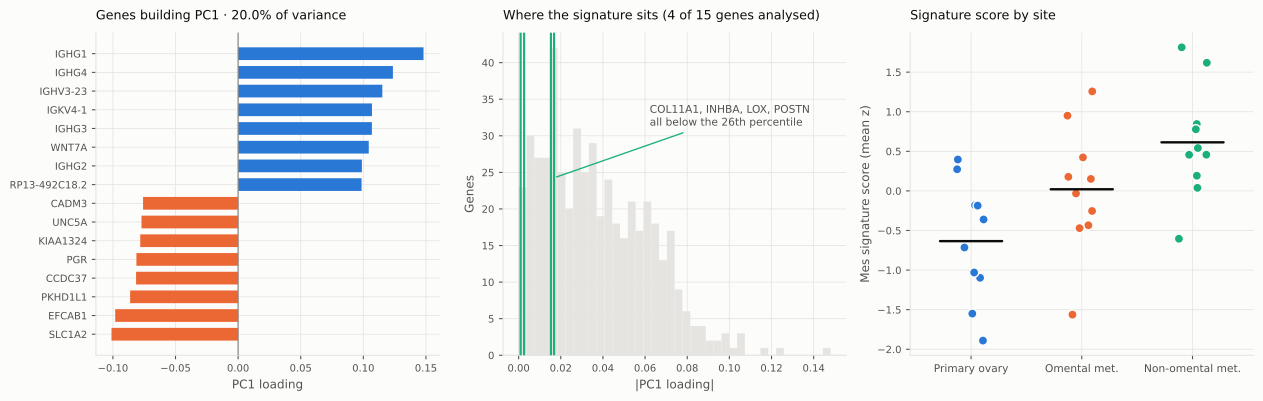
Eight of the twelve largest absolute loadings are immunoglobulin genes.
Immune composition, immunoglobulin activity, repertoire differences or quantification behaviour.
Plasma-cell abundance or clonality cannot be inferred from these loadings alone.
The observed site statistic stays fixed; its reference changes
Site labels can move across all 30 samples.
Site labels move only inside each matched triplet.
What this analysis establishes—and what it leaves open
Limitations
Thirty bulk, FFPE samples cannot resolve cell types. The non-omental category combines several intraperitoneal locations, and the first two PCs show only 30.0% of total variance.
External biological context
Compartment-resolved proteomics found patient-specific tumour signatures and site-associated stromal structure. This bulk analysis is consistent with that picture but cannot assign either effect to a compartment.
Eckert et al.Reproducibility
The workflow pins dependencies, verifies source files, validates the PCA against scikit-learn and records two source-data defects without guessing ambiguous metadata.